Managing Data Quality Issues in the BaseCap Analytics Platform
Designing a system to help clients remediate data issues through collaboration

Company: BaseCap Analytics
Role: UI/UX design
Year: 2021
Context
This early stage startup was building the initial version of their product. One of the primary features was a way for clients to log and track data quality issues.
Challenges
Existing clients did not want another ticketing system to compete with their internal systems. In addition to analysts being able to address individual issues, we wanted to give management the ability to track statistics.
Solution
When data failures are detected by the system, issues are automatically created and added to a data table. Each row in the table has buttons to view more details or snooze notifications about the issue for two weeks. Tiles above the table highlight important topics to be addressed by data analysts. A filter button in the bottom right corner of each tile filters the table by the criteria of the tile.
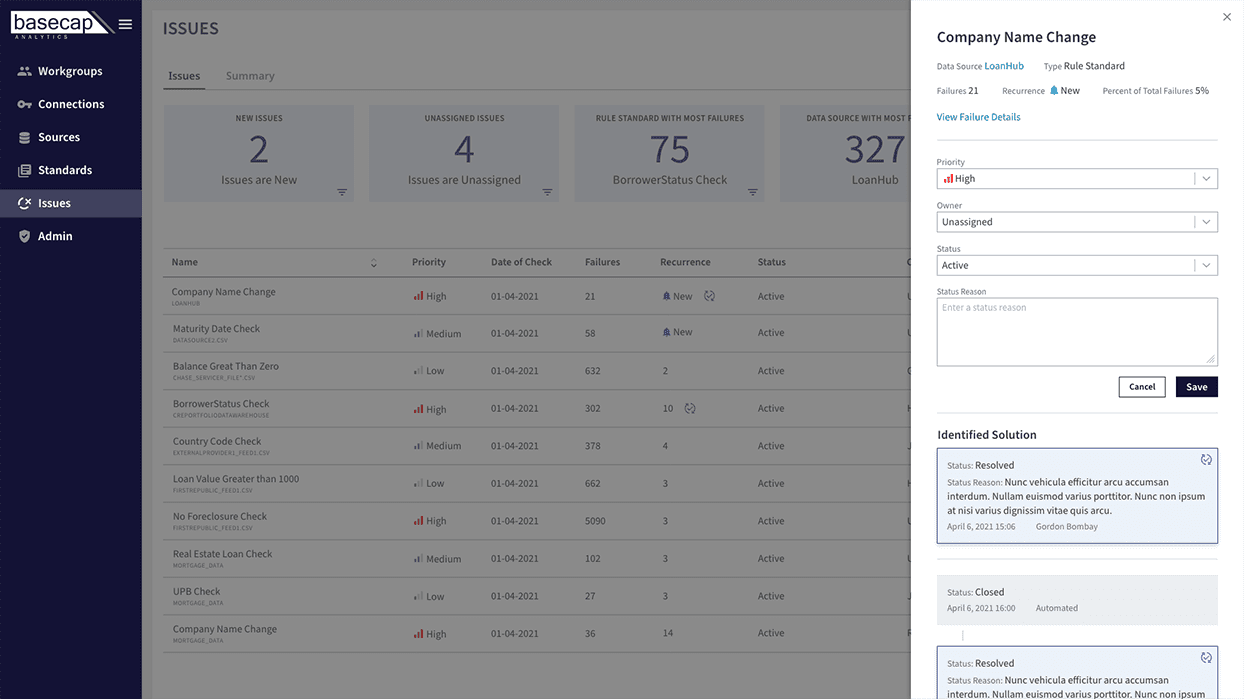
Clicking a View button on the table opens a slideout panel with details about the issue, interactive elements to set the priority, assign a user, and change the status, as well as an audit trail of all changes to the issue. A text area is included to allow users who solved an issue to enter the instructions for resolving the issue if it reoccurs in the future. Once submitted, a button on that item in the audit trail can be clicked to mark it as the Identified Solution.
The Summary tab uses artificial intelligence to find trends and items of importance to help data analysts and managers identify issues that are having the largest impact on their business.